In addition to my research, I also do freelance scientific illustration, data visualization, and infographic making. This includes scientific illustration, data visualization, and infographic design. My expertise includes creating GANNT charts, conceptual diagrams, annual reports, spatial visualizations, spatial animations, visualization of large data sets, and more. Ultimately, I help scientists to enhance the clarity and impact of their research.
I work with the University of New Hampshire Research and Large Center Development Office, providing graphic design support for large grants and publications. Additionally, I have experience designing for events, book tours, websites, and more.
Please contact me for a quote for your next scientific illustration or for assistance with data visualization!
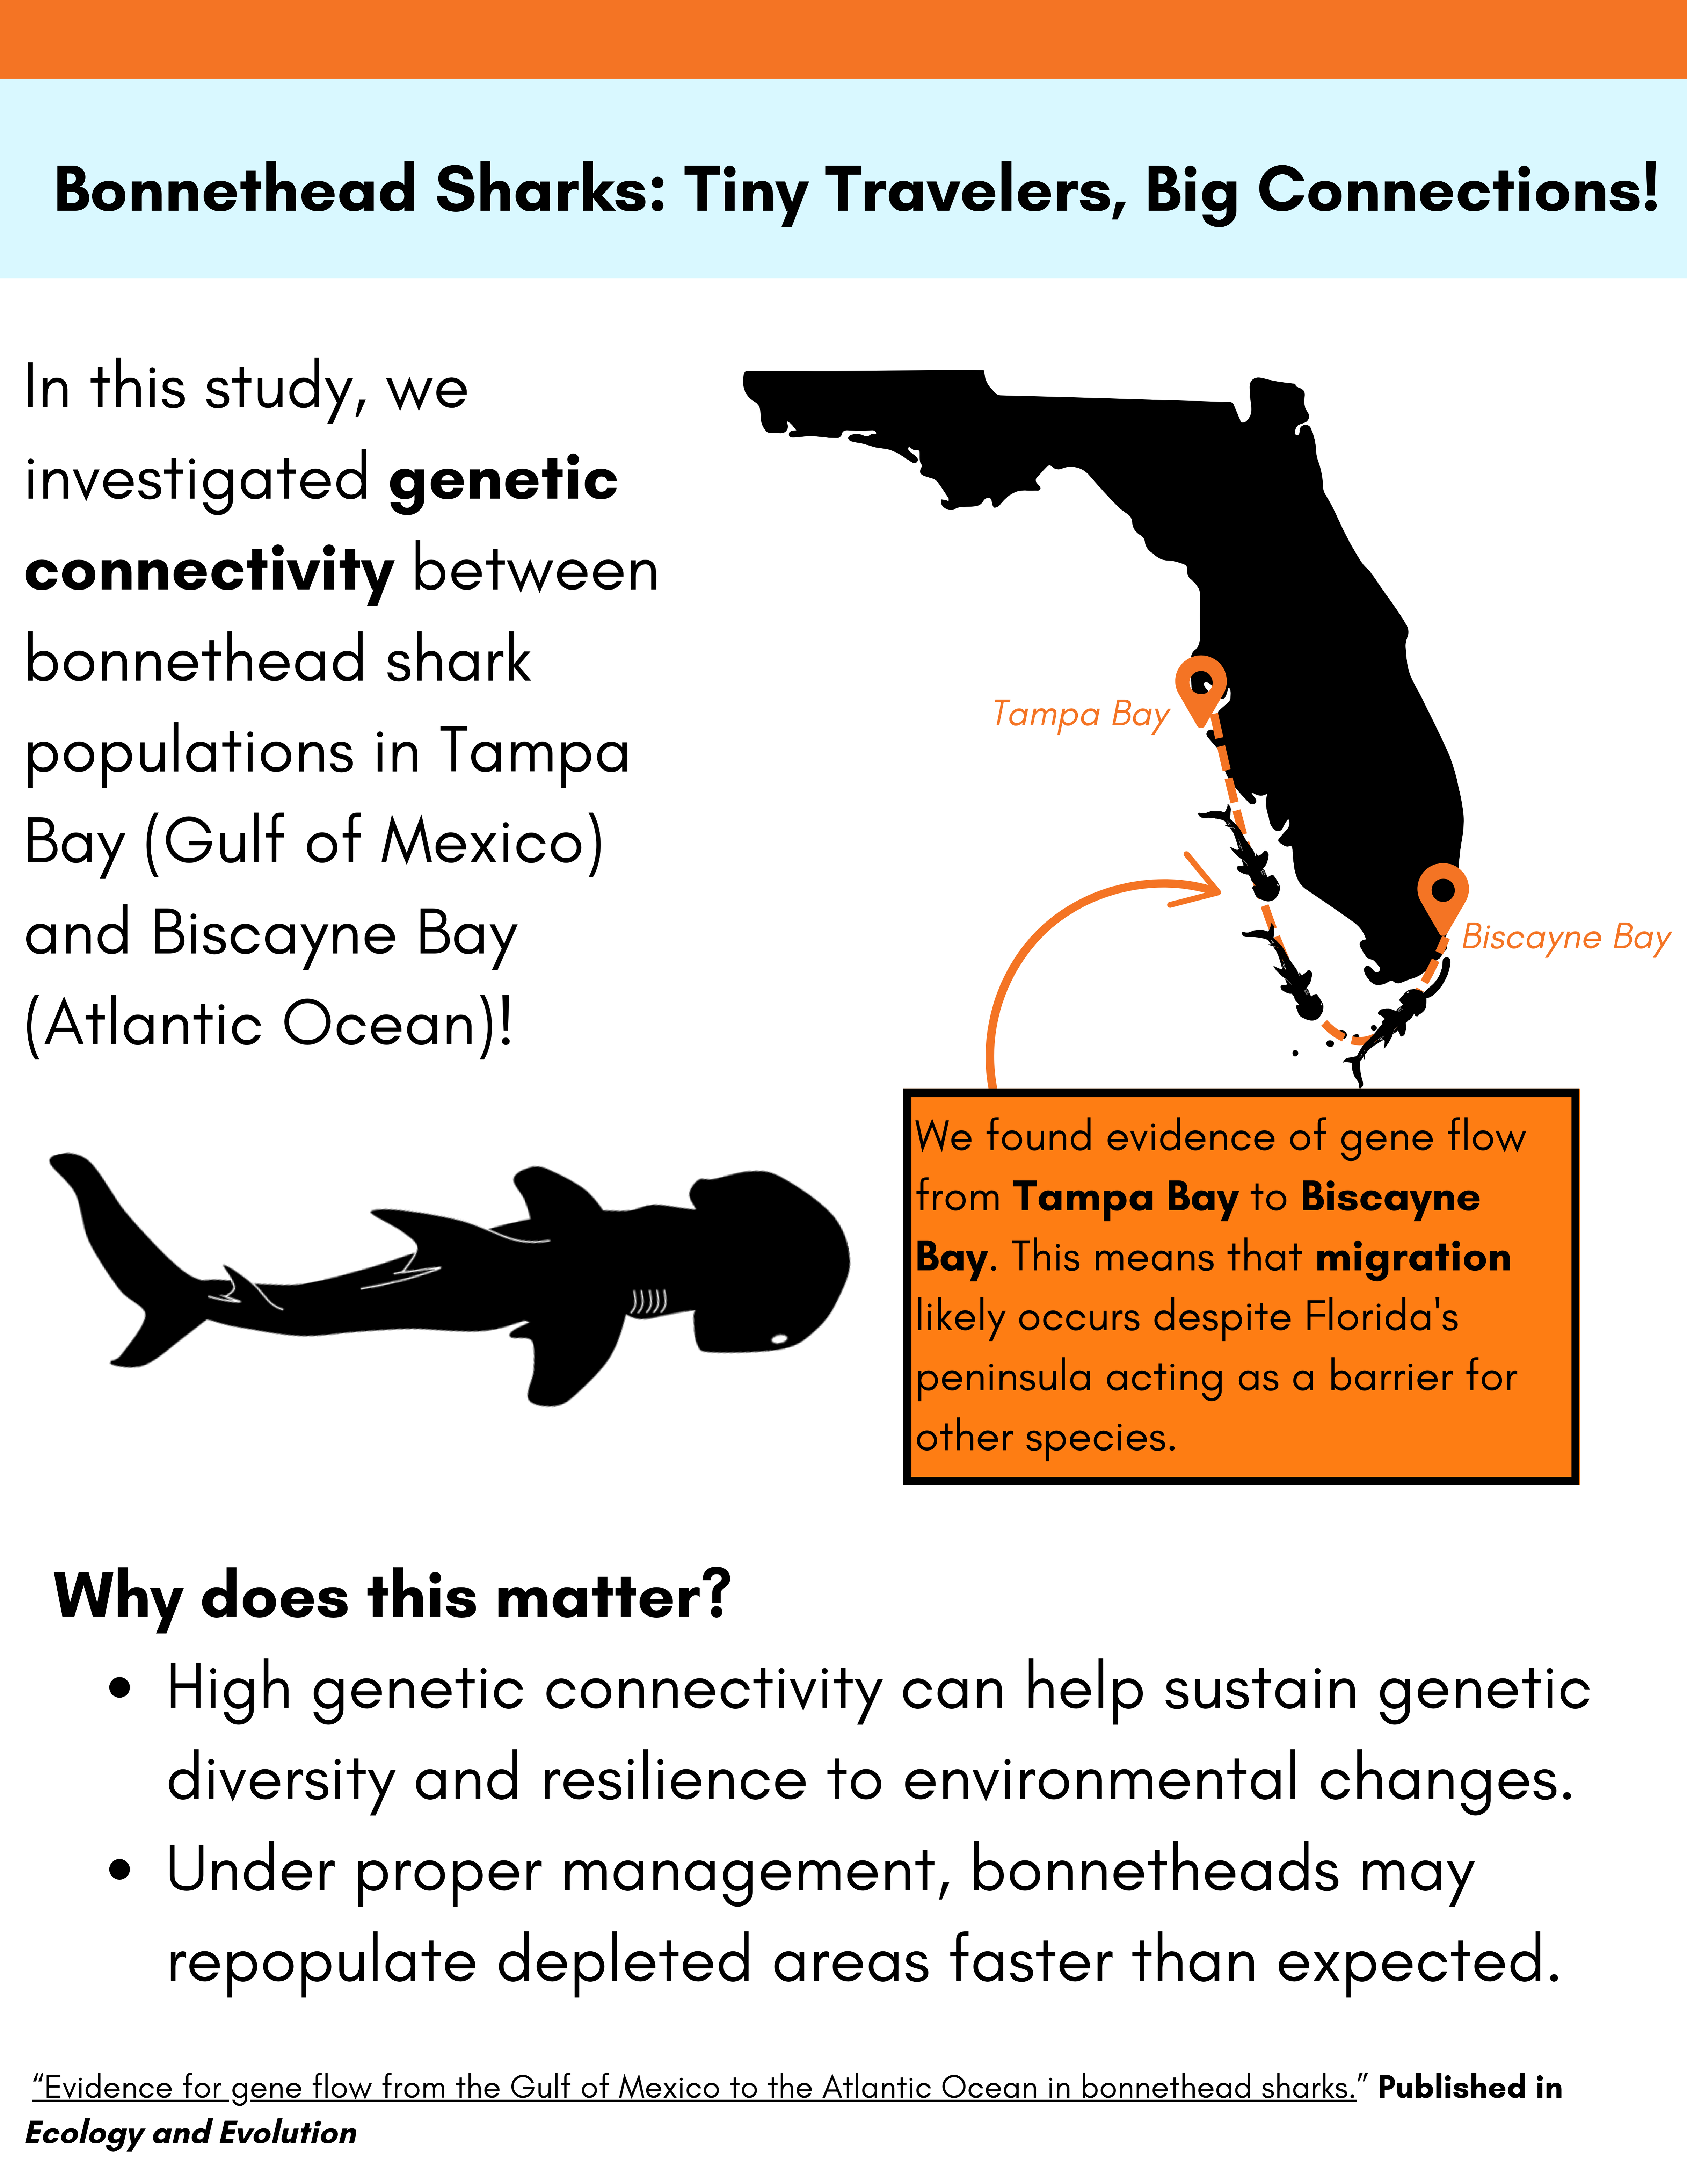
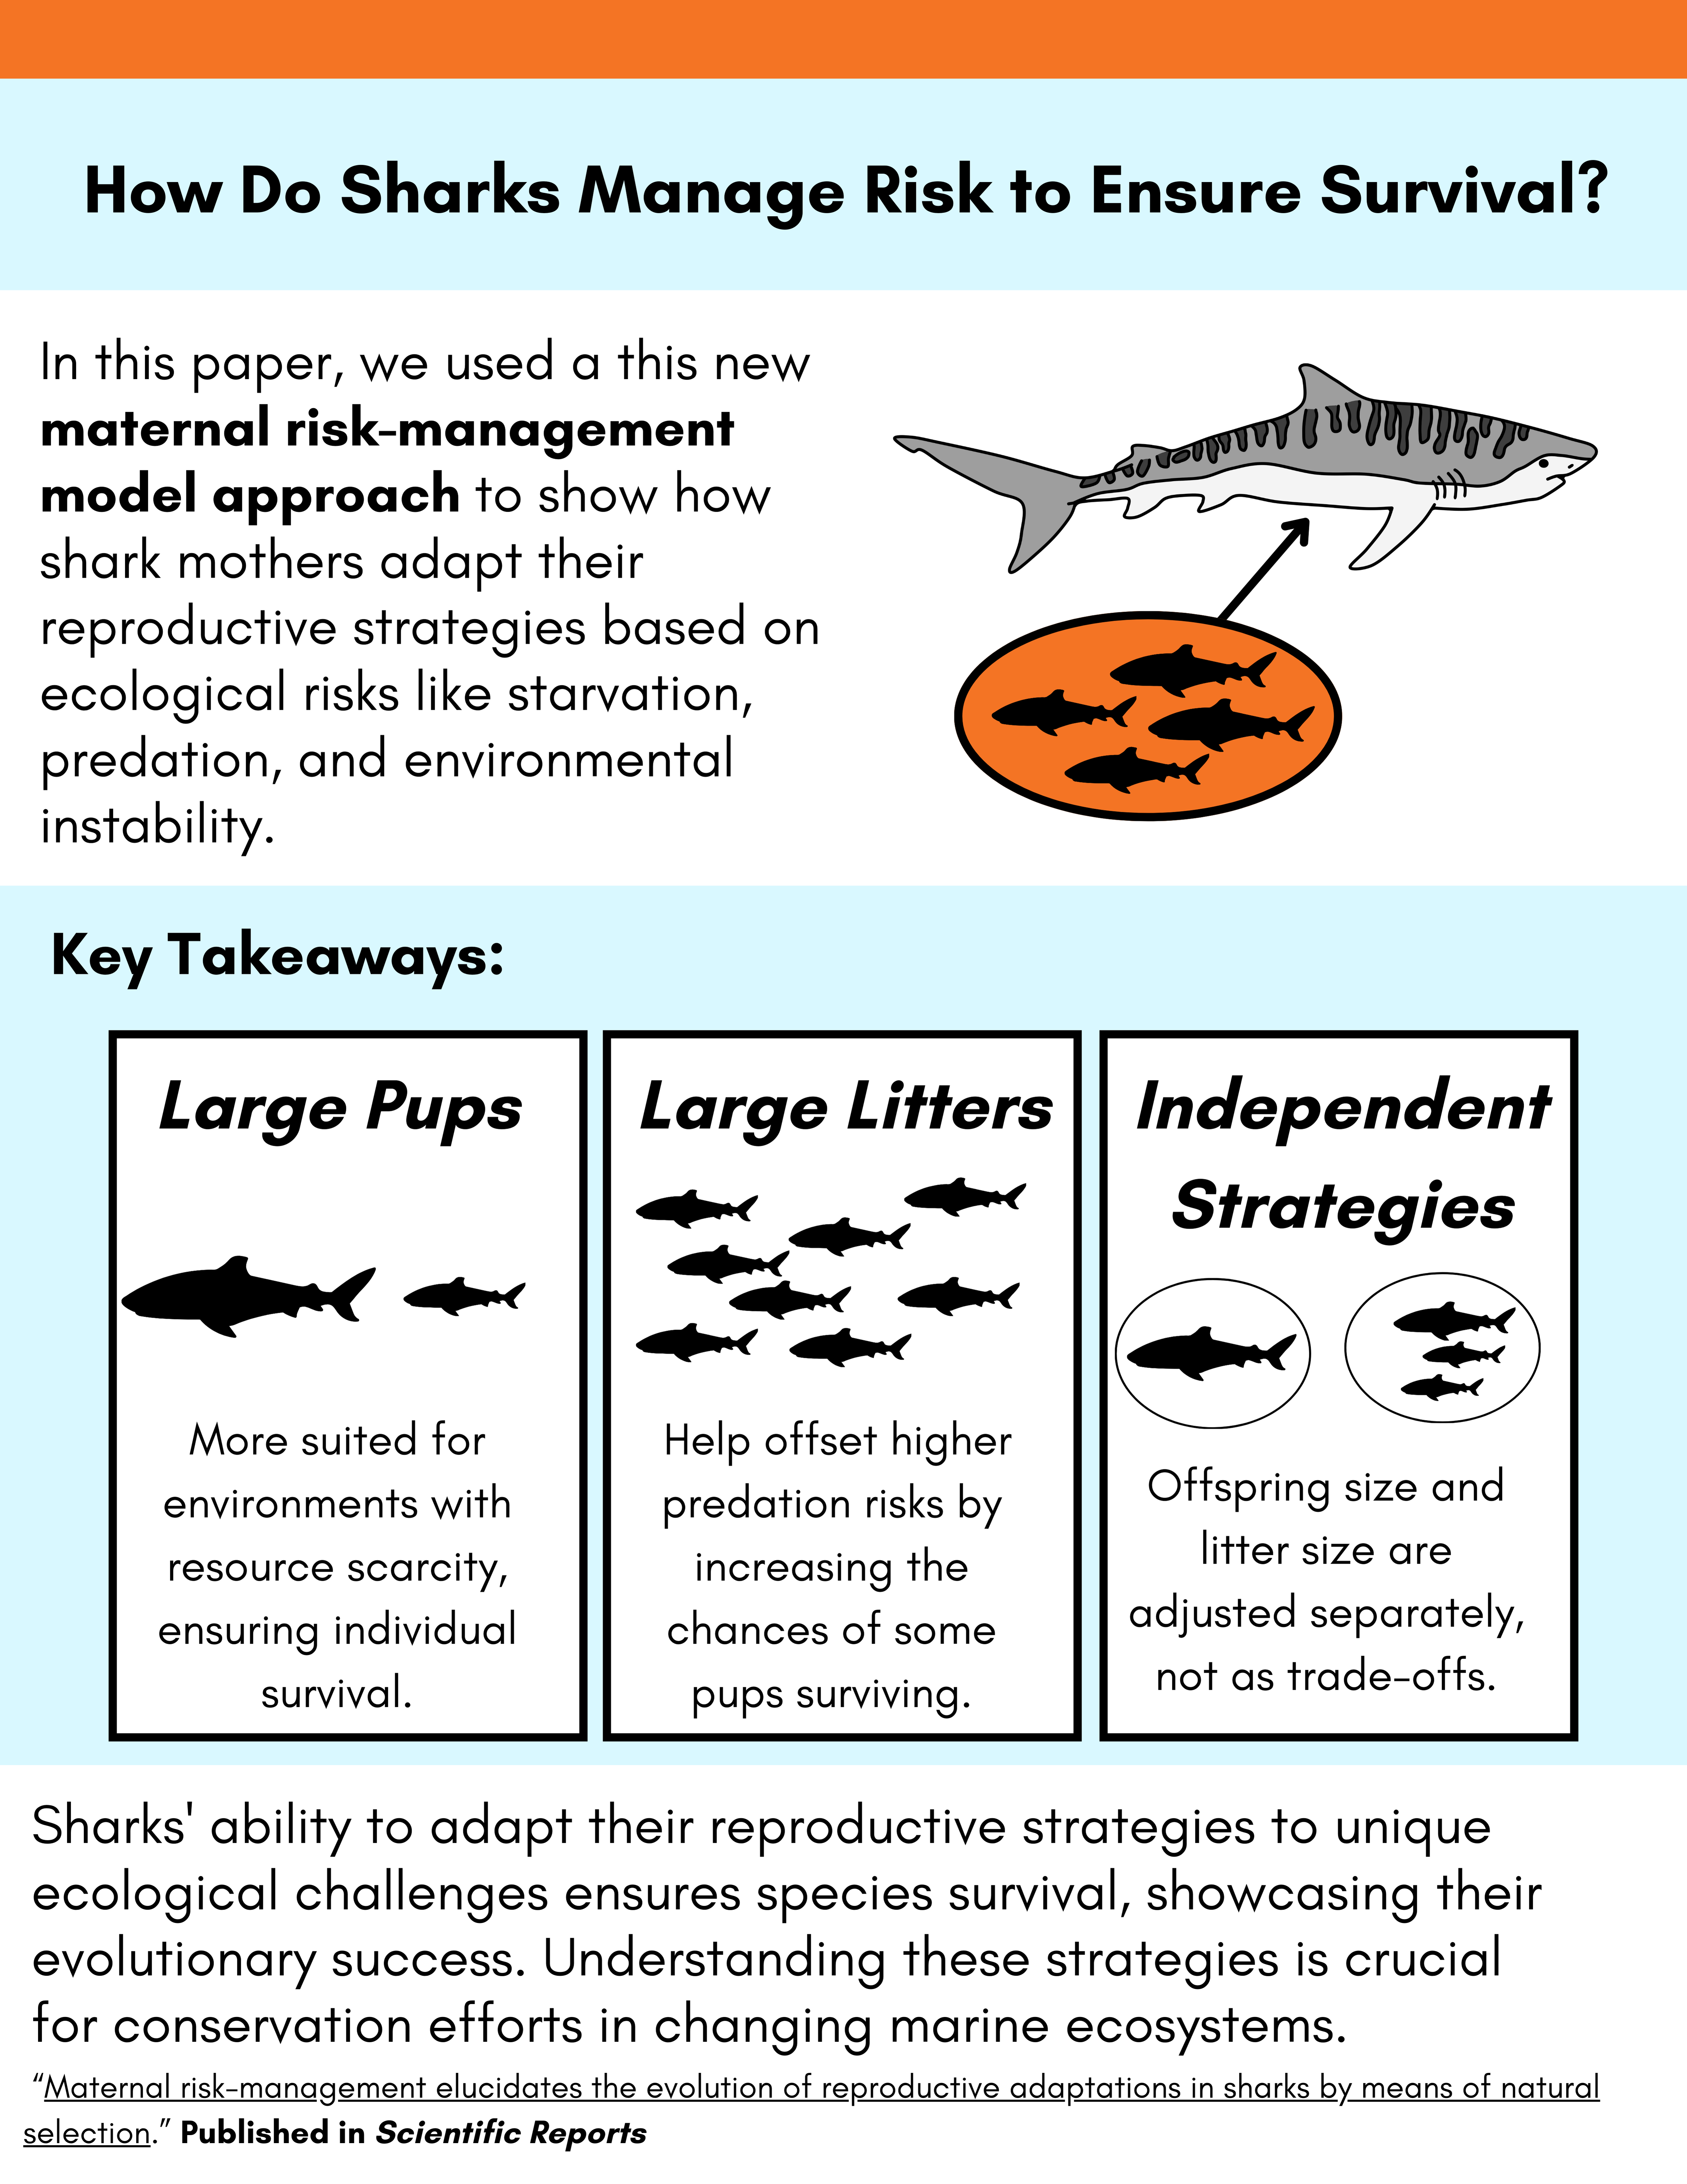
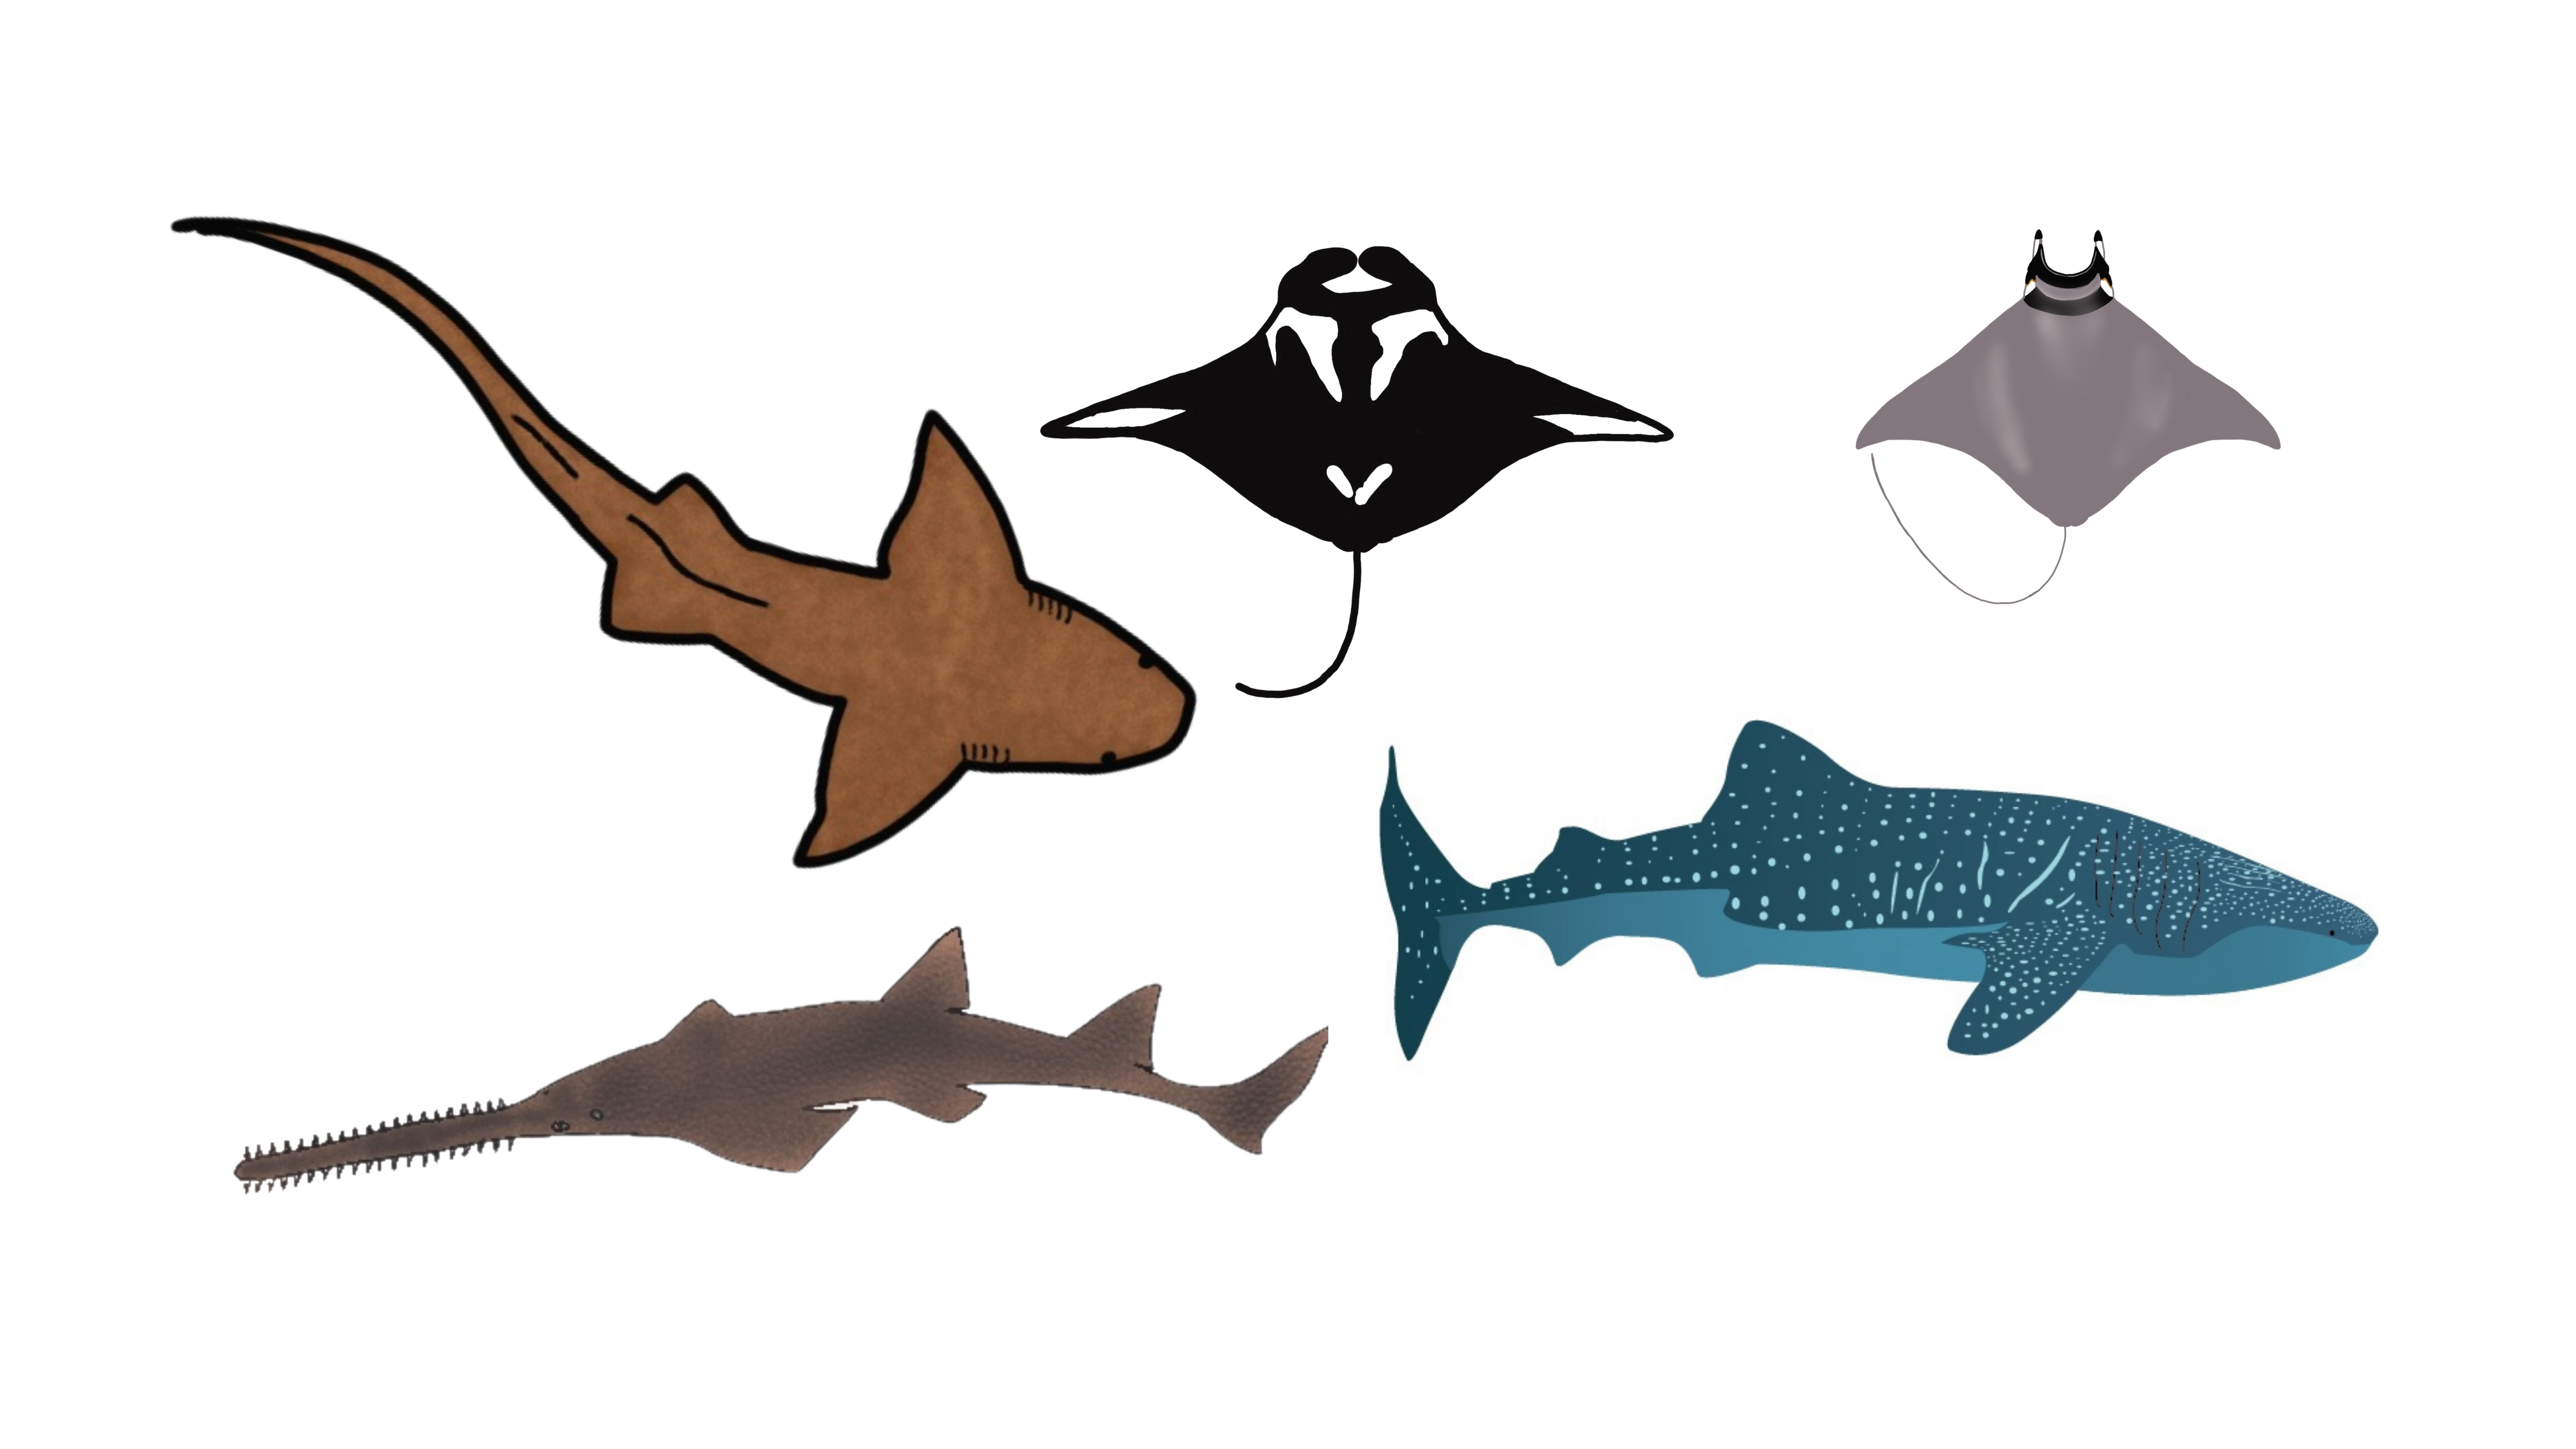
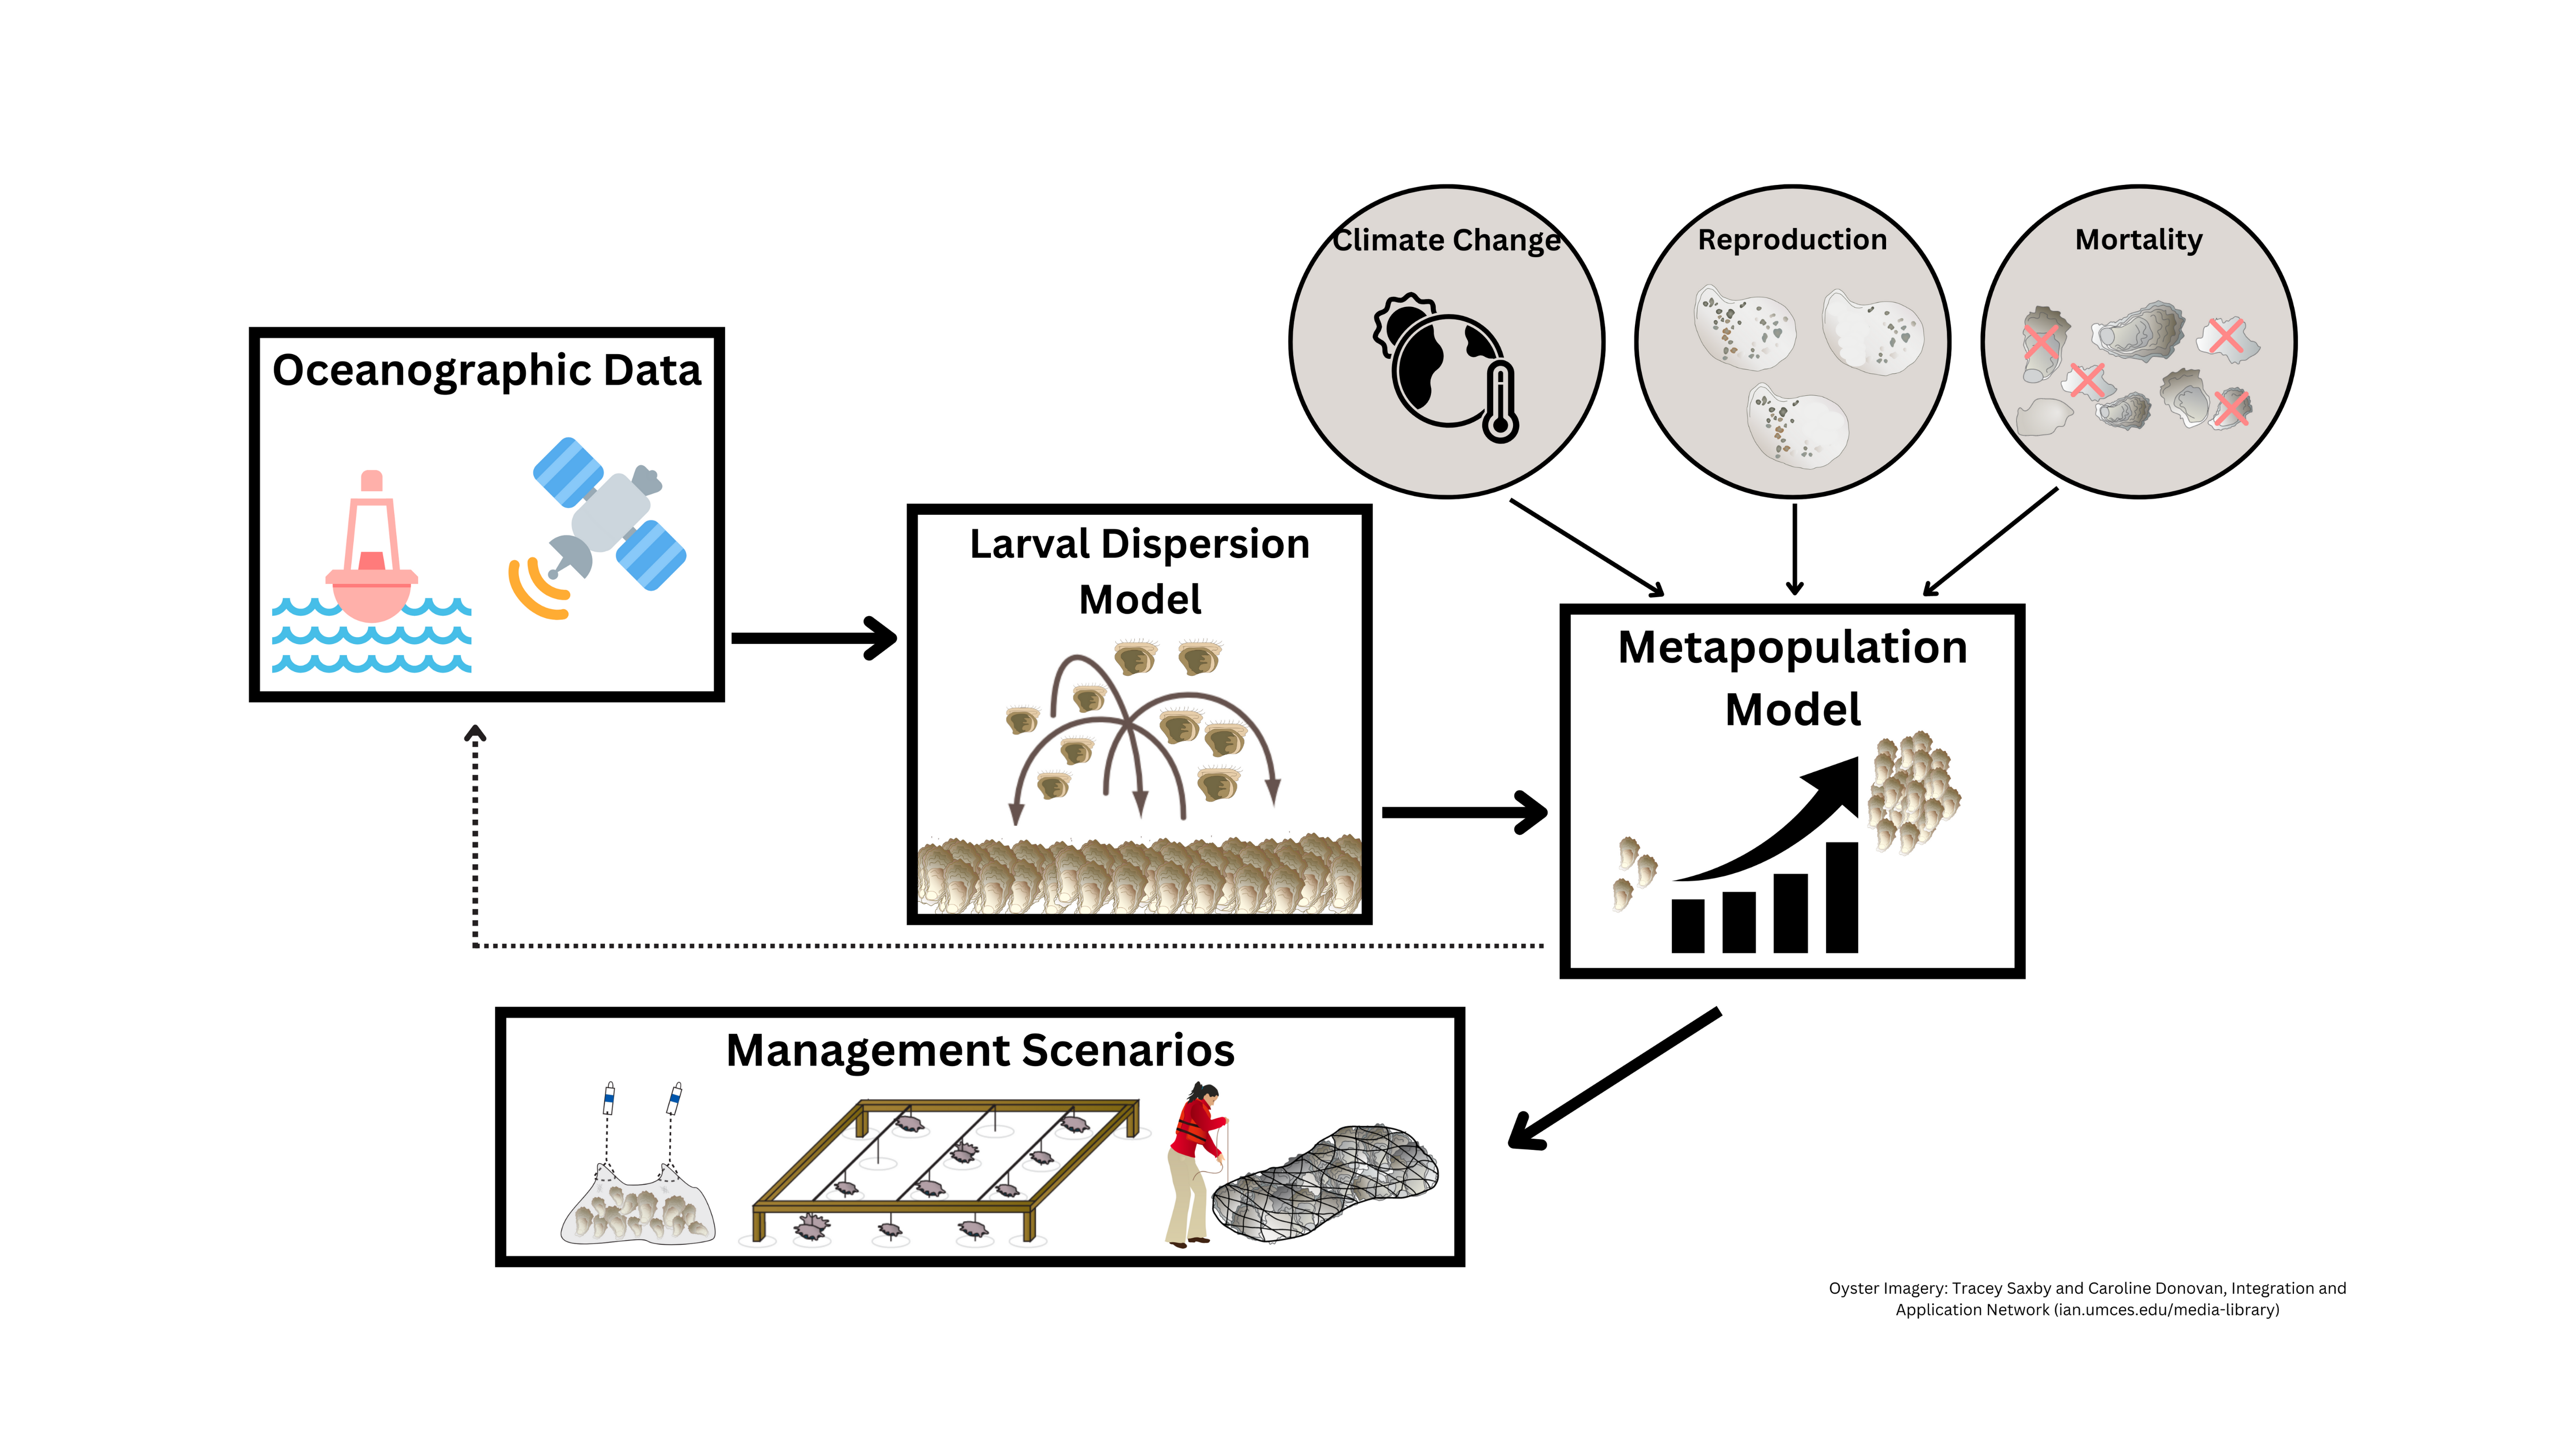
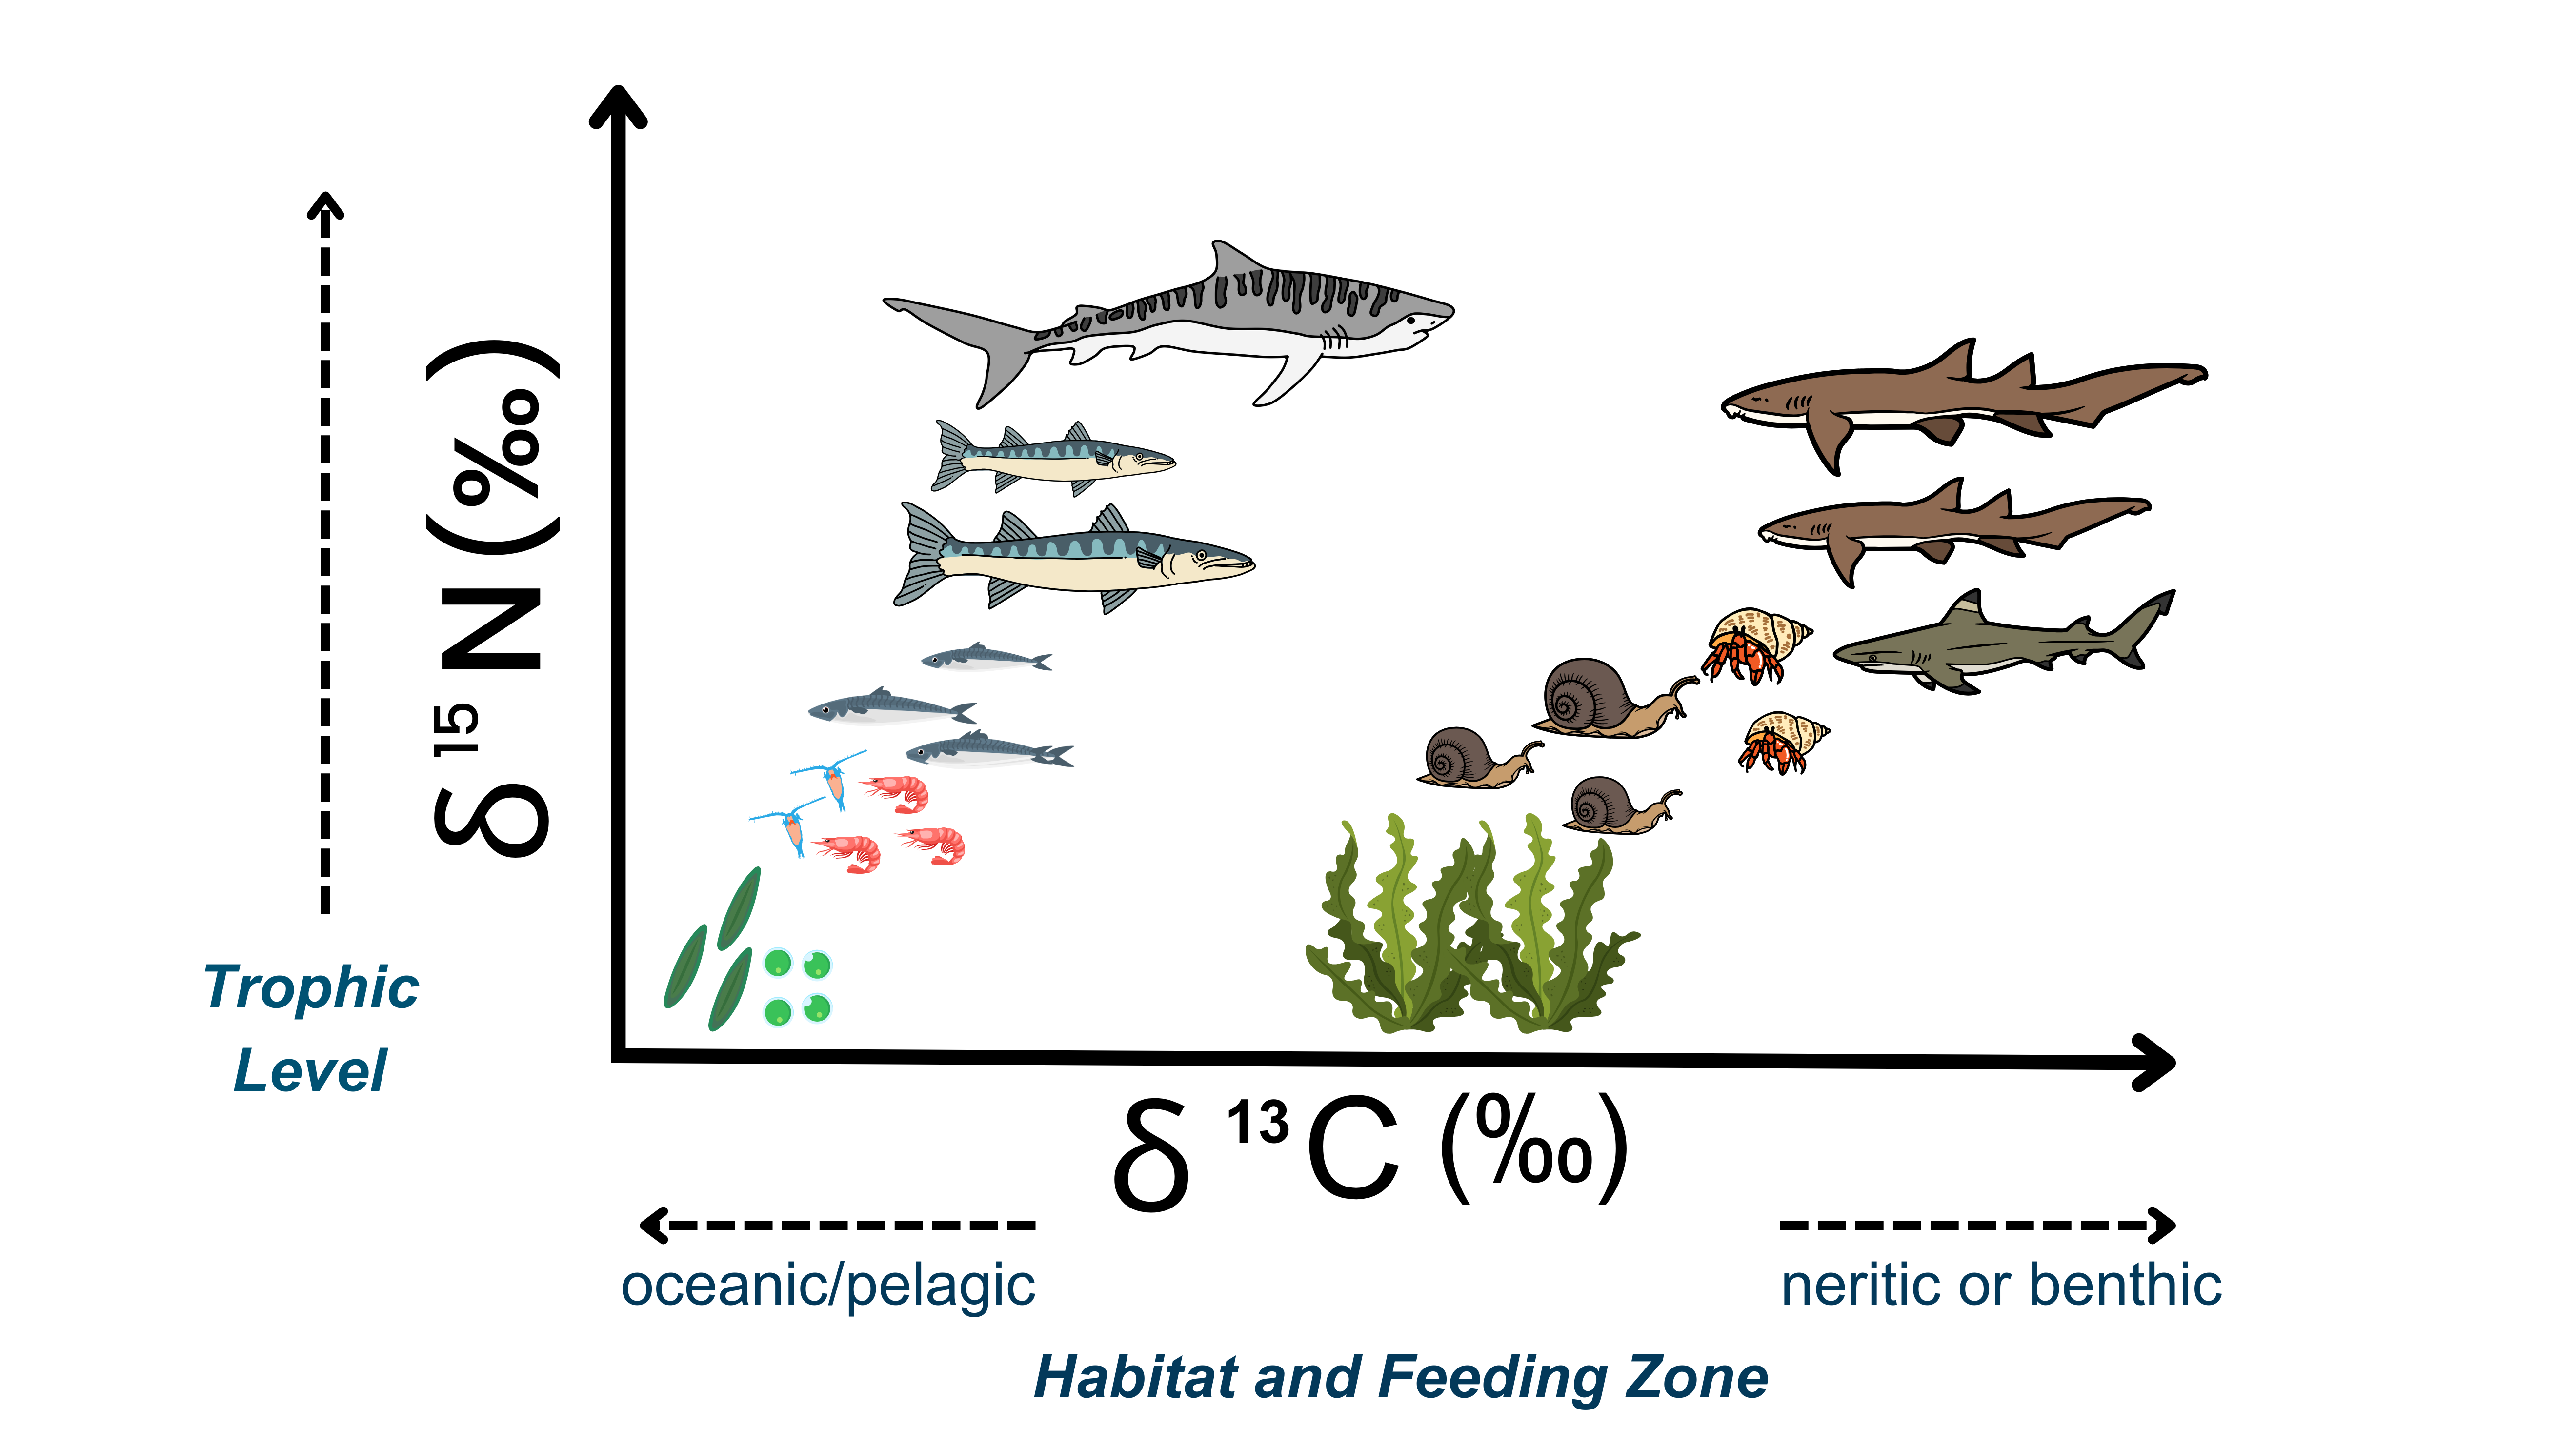
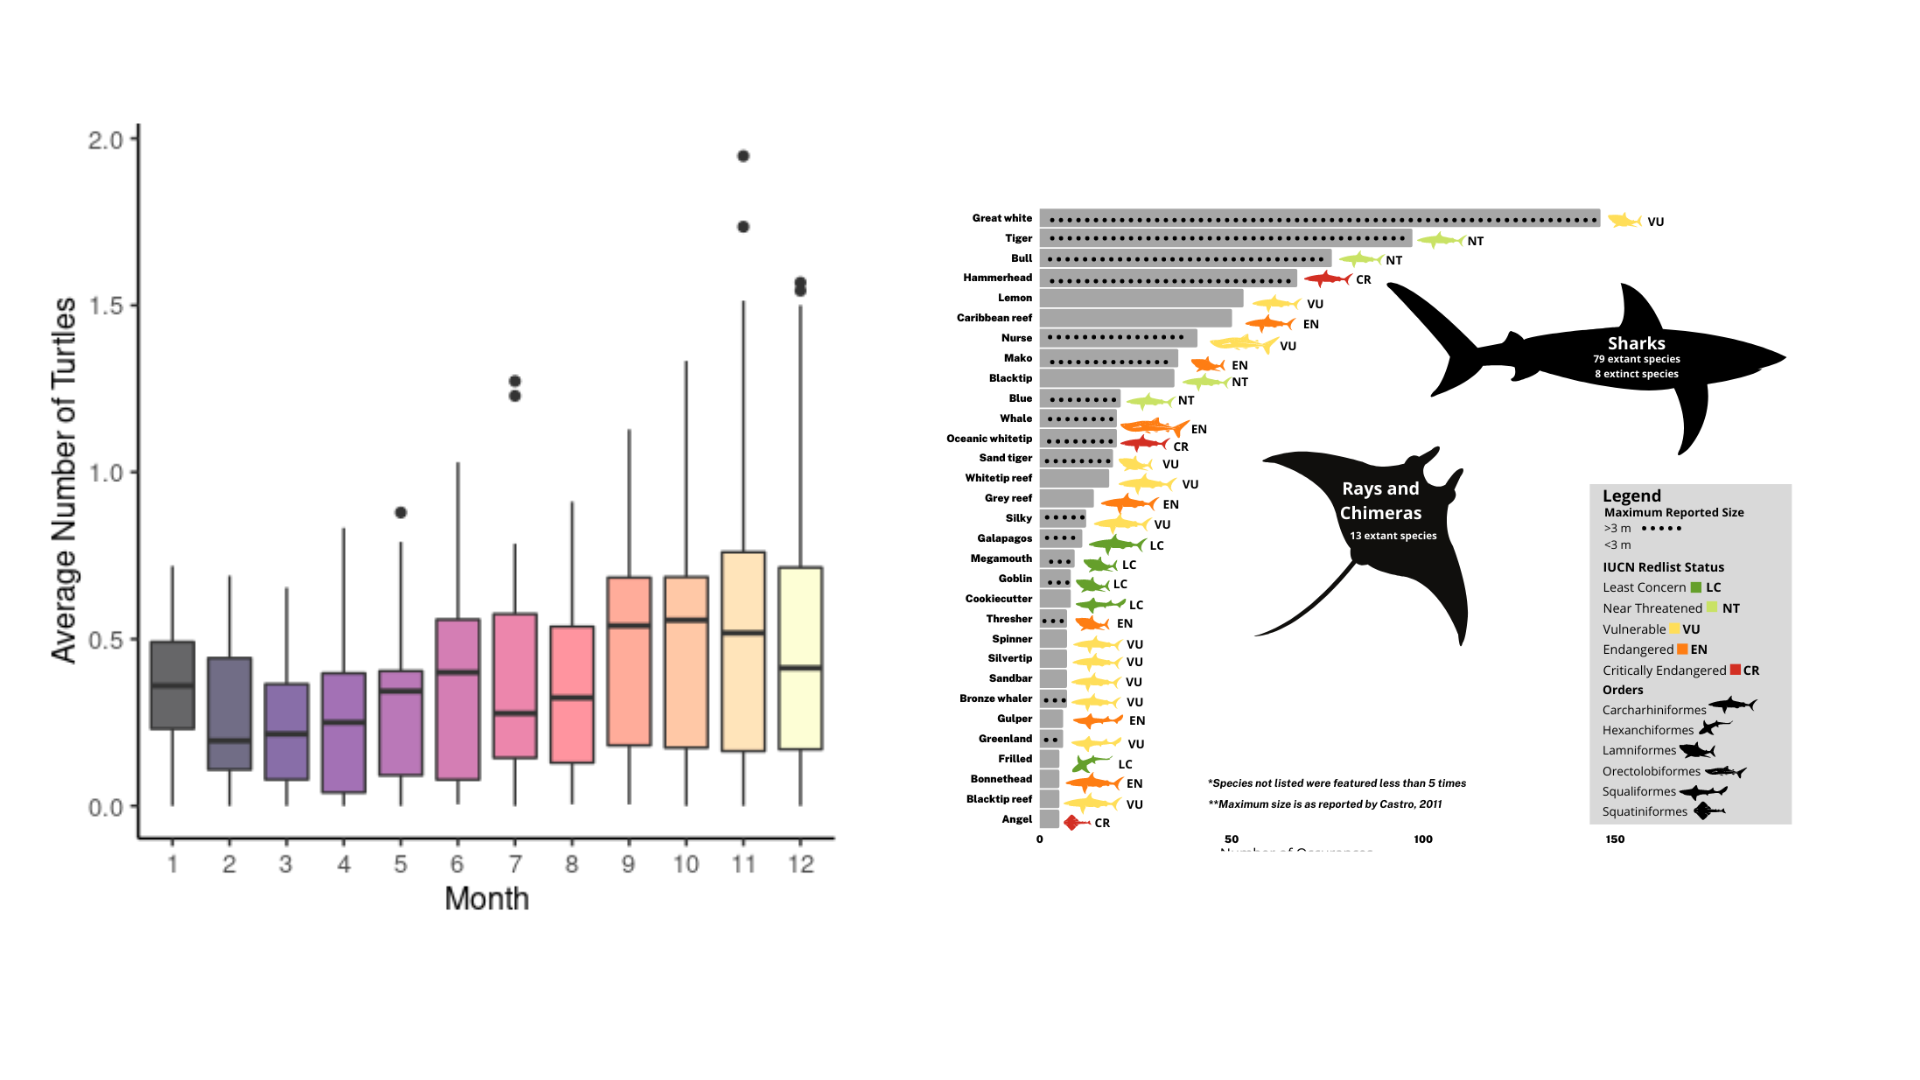
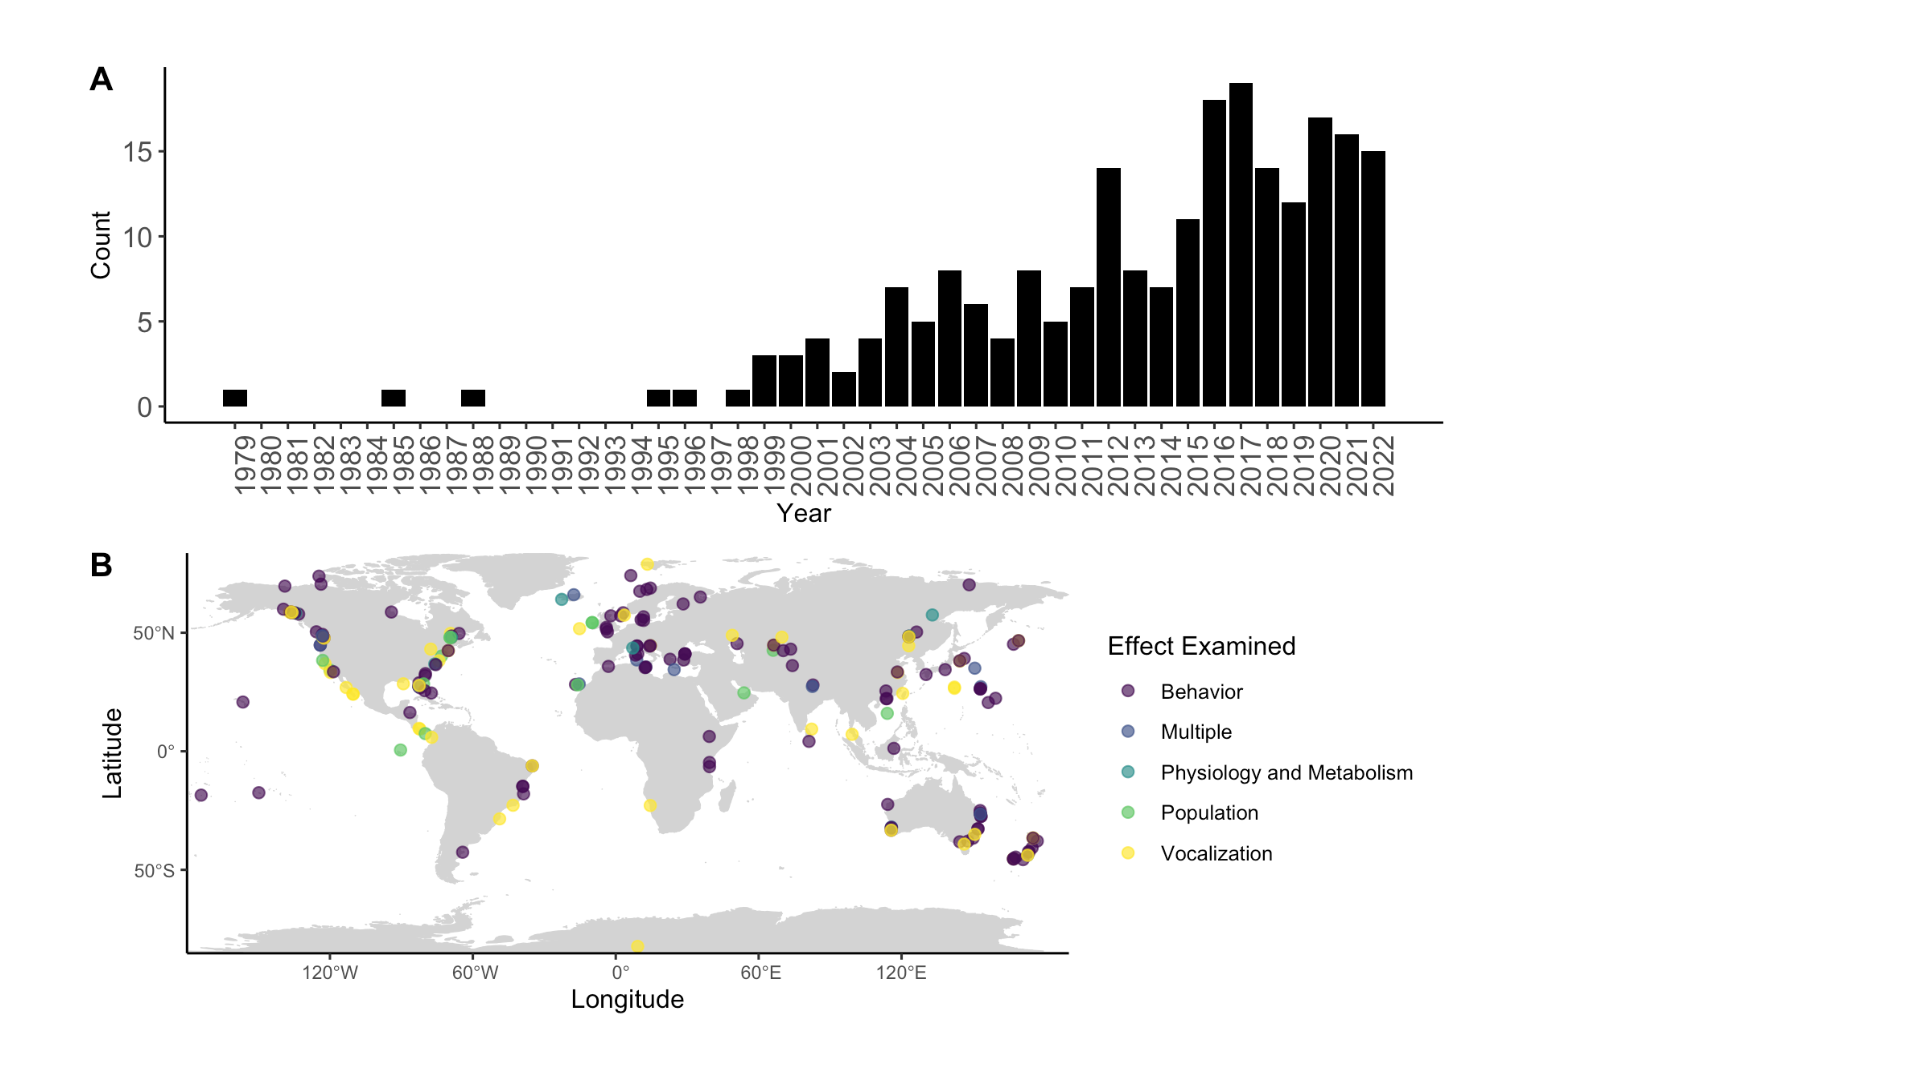
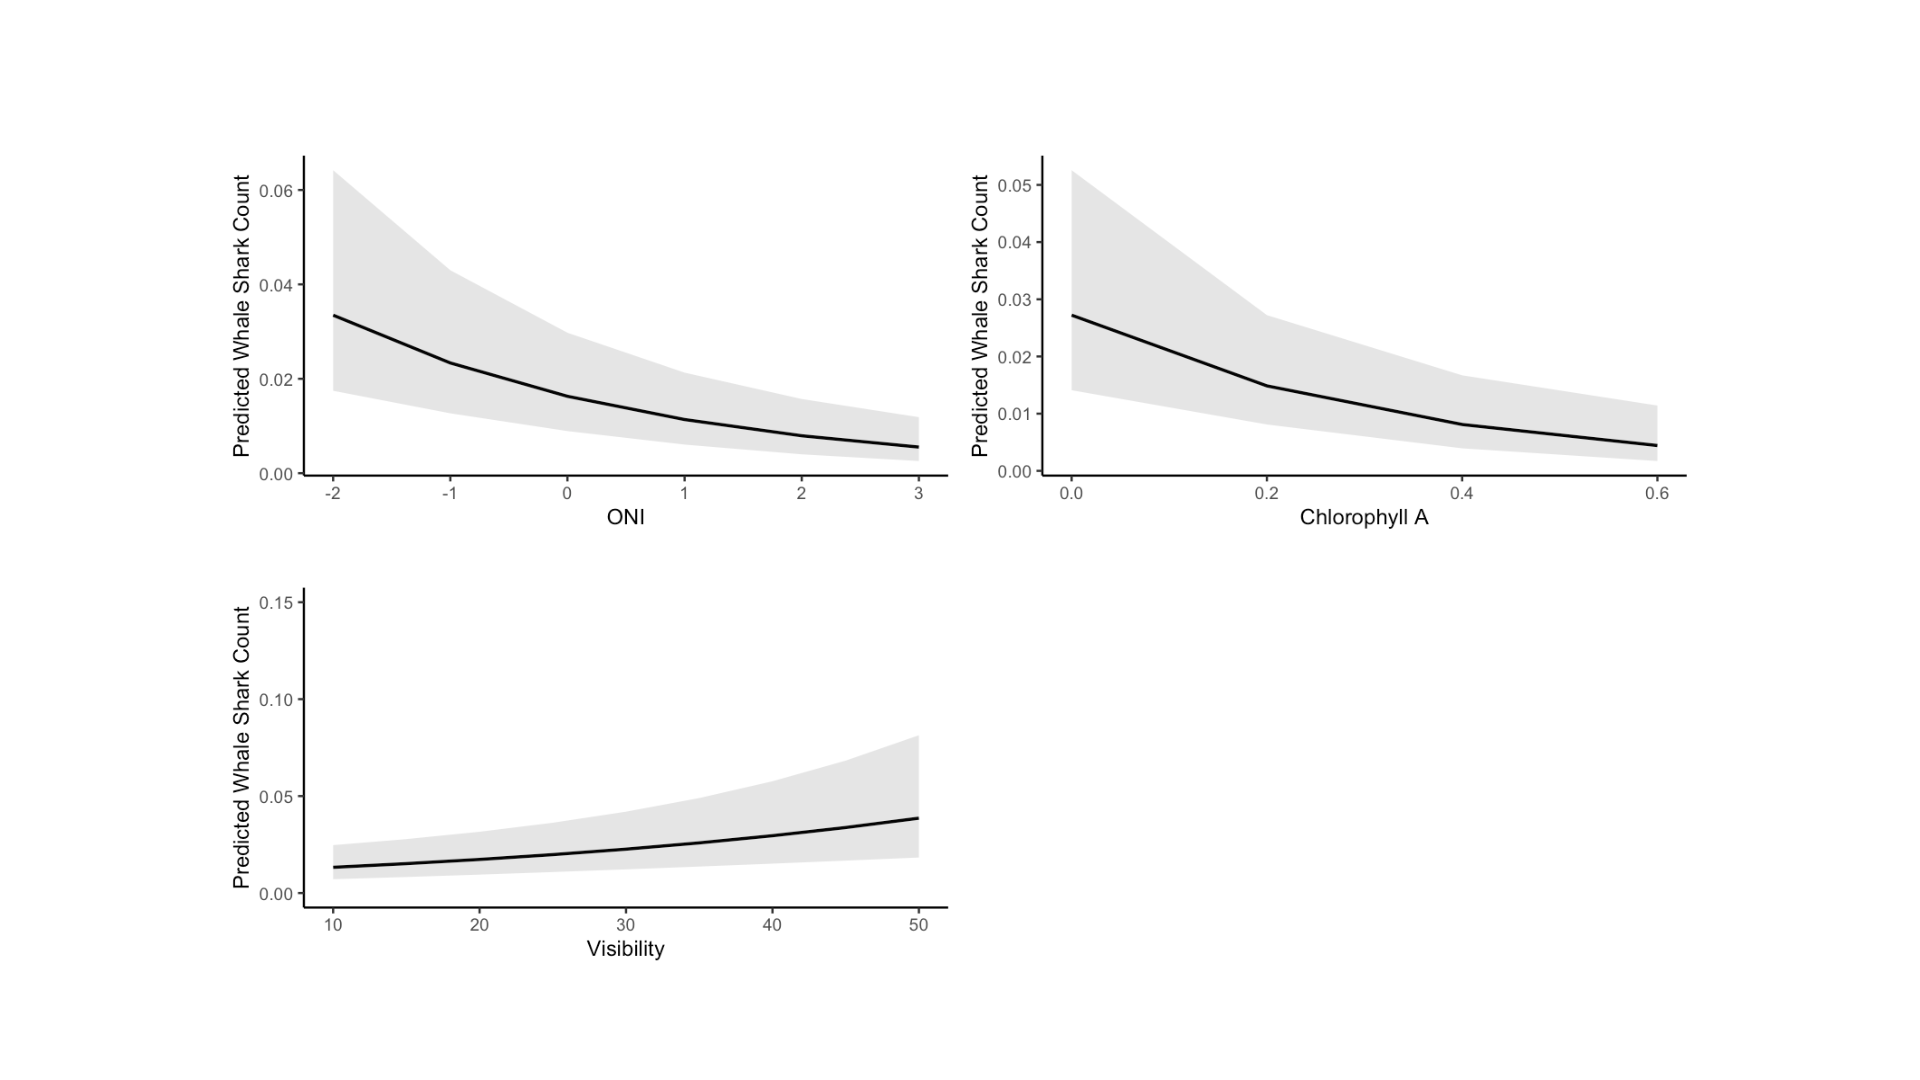
Below are some examples of infographics, spatial analyses, graphical abstracts, illustrations, and conceptual diagrams I have made. I construct my diagrams with a variety of softwares, and use my own, and open source SVG files and species illustrations.